The success and sustenance of your content marketing strategy depend on how well users engage or interact with your brand. Measuring user engagement gives you an insight into what users expect from your brand, enabling you to tailor your products, services, and content according to your audience’s needs. This post will cover user engagement, its significance for businesses, metrics that help measure it, and ways to improve it.
What is User Engagement?
User engagement is a measure that indicates how frequently and efficiently users, customers, or followers interact with your website, app, or content. It shows how successful you are in providing value to your audience.
If users engage with your site or app well, it will be evident from their actions. They will spend more time on your site, like and share your content, click on CTAs, and visit multiple pages.
User Engagement Vs. Customer Engagement
User engagement focuses on all users who land on your site, use your app, or interact with you on social media. In contrast, customer engagement is about how effectively customers engage with you.
Simply put, user engagement covers customer engagement, while the opposite is not true.
Why is User Engagement Important?
User engagement directly affects the profitability and sustenance of a business. Highly engaged users are likely to turn into loyal customers and increase the revenue of your business. Additionally, they will likely become advocates of your brand, recommending it to their friends and family. Most importantly, engaged users tend to pay premium prices for your products or services.
How to Calculate Social Media User Engagement?
Social media user engagement or social media engagement is the measure of how users interact with your social media.
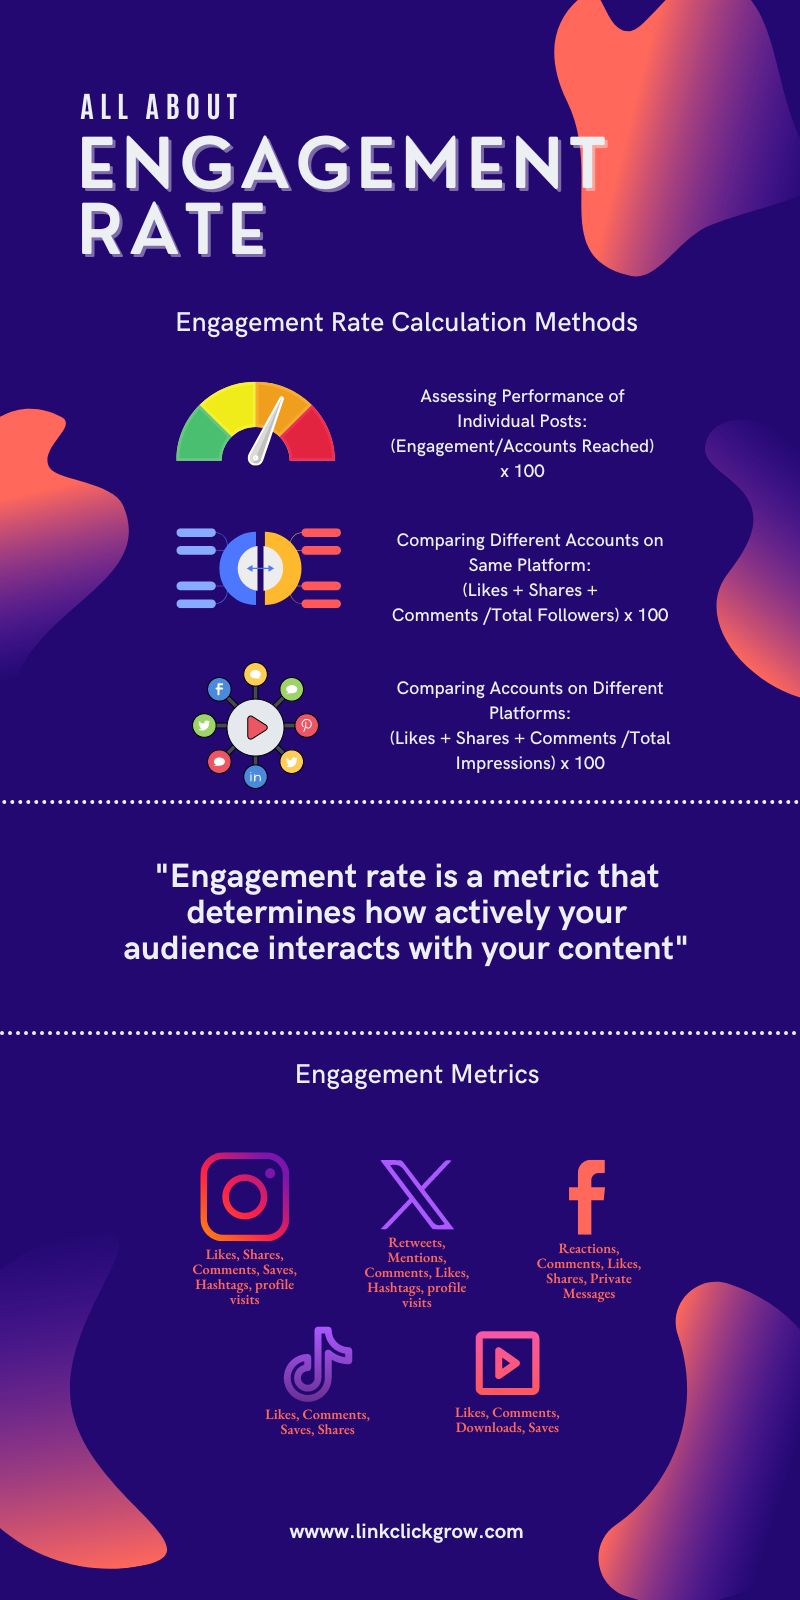
To calculate the social media engagement rate, divide the sum of likes, shares, and comments by the total number of followers and multiply by 100. However, to compare your performance across various platforms or to assess how well you do in comparison to your competitors, engagement rate is calculated differently, as shown in the figure below:

User Engagement KPIs for Websites and Apps
Measuring user engagement for websites and apps is more complex than for social media. There is no single formula to calculate user engagement. Instead, you need to consider several metrics to determine how well users interact with your brand.
Google Analytics is a free service that gives insights into website traffic and provides reports and metrics showing how visitors interact with your website or app. You can track various user engagement metrics in Google Analytics. However, for WordPress users, MonsterInsights is a popular Google Analytics plugin that enables users to see analytic reports within the WordPress dashboard. Using MonsterInsights, you can see real-time stats right within your WordPress.
The following are a few user engagement KPIs or metrics you may consider to assess your performance:
Bounce Rate
The bounce rate is a helpful metric that shows the percentage of people who quit your website after visiting only one page. In other words, it is the percentage of visitors who land on your site and then leave from the same web page they entered without performing any action or clicking on anything.
To calculate bounce, divide the sum of one-page visits by the total website visits. For example, if ten people land on your website, out of which five bounce back without visiting any other page, the bounce rate becomes 5/10 x 100 = 50%.
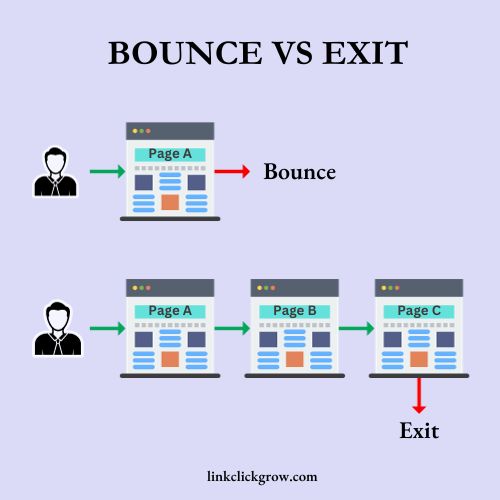
Many people confuse bounce rate with exit rate. They are similar but different measures. A bounce is when the user visits only one page of your site, while an exit is when the user visits more than one page before leaving.

A high bounce rate may indicate many issues, such as a mismatch with search intent or poor website navigation. These issues lead to a poor user experience, causing visitors to bounce back. A high bounce rate can be detrimental to SEO rankings as well.
Page Views
Pageviews is another user engagement metric that defines the total number of web pages viewed in a given time frame. Remember, it includes all recurring views of a single page.
For example, if a user lands on your web page, it is one pageview. However, if the same user refreshes the same page, it is another pageview. In short, each time the web page is loaded, even if by the same user, it counts as a pageview.
On the other hand, unique pageviews aggregate the pageviews the same user generates within a single session. Simply put, multiple refreshes or views by the same user count as one only. Therefore, if the same user loads the same page ten times in the same session, it will increase the pageviews count by ten and unique pageviews by only 1.
Time Spent on Page
Time spent on the page is a critical user engagement metric. It indicates the average time users spend reading content on a web page. A higher time spent means that people find the content relevant and valuable. On the contrary, a lower time spent indicates the users are quitting the web page without reading the entire content.
An average person with a regular reading speed reads 200-250 words in a minute. If your average article length is 2000 words, you should expect the visitors to read the content in 8-10 minutes.
Remember, time spent on page can affect your Google rankings as well. Google aims to provide the most relevant and quality results to its searchers. It considers low time spent on a page an indication of irrelevant or low-quantity content.
Therefore, higher time spent on the page leads to higher ranking. In contrast, lower time spent can negatively affect your ranking.
Pages per Session
Pages per session is among the user engagement metrics that genuinely reflect how actively users engage with your website. It is the average number of pages a user visits per session. Higher pages per session shows visitors are navigating your website, visiting and engaging with more than one page.
To calculate the pages per session, divide the number of pages all users visit by the total number of sessions.
However, at times, pages per session can be misleading. Therefore, consider session duration and bounce rate when analyzing pages per session. A web page with high pages per session value but low session duration and bounce rate may indicate disinterest in your content. It may also suggest that the users are having difficulty navigating your site.
Unique Visitors
Unique visitors is the sum of people who land on your site within a particular timeframe. Only the first visit of a single visitor counts when measuring unique visitors. Any additional visits of the same person do not count.
Unique visitors is a metric that helps businesses assess their audience reach to devise a better marketing strategy. It is beneficial for evaluating the performance of a specific marketing campaign. Similarly, you can use it to compare your audience reach with your competitors.
New Vs. Returning Visitors
New visitors is the total of people who visit your site for the first time. In contrast, returning visitors are people who have previously visited your site.
If the returning visitors count is higher than the new visitors count, it shows users like your content. On the contrary, if the new visitors count is higher than the returning visitors count, it indicates you need to do more to turn visitors into loyal customers or readers.
Conversion Rate
Conversion rate is another helpful user engagement metric. It is the percentage of website visitors who complete an action on your site, such as:
- Making a purchase.
- Signing up for a newsletter.
- Downloading a free resource.
- Starting a free trial.
- Becoming a registered member.
The conversion rate shows the efficiency of your marketing efforts. It tells you how well your content persuades visitors to complete an action. The higher the conversion rate, the better your content is performing concerning your marketing goals.
To calculate the conversion rate, divide the number of visitors who complete an action by the total number of visitors and then multiply by 100. For example, if you had 1000 visitors in a month, of which 200 completed an action, the conversion rate becomes 200/1000 x 100 = 20%.
Abandonment Rate
The abandonment rate is the percentage of shopping carts abandoned out of all initiated transactions. This engagement metric is helpful for e-commerce businesses. To calculate the abandonment rate, you first divide the number of purchases by the total number of carts created. Then, you subtract the result from 1 and multiply by 100.
For example, if 50 people create carts, of which 10 complete purchases, the cart abandonment rate becomes (1-10/50) x 100 = 80%.
A high cart abandonment rate may indicate several issues that affect user engagement, such as:
- Poor website performance.
- Lack of payment methods.
- Complicated checkout process.
- Missing return or refund policy.
- Security concerns.
In short, the cart abandonment rate can significantly help businesses improve user experience and increase sales.
Retention Rate
Retention rate is a metric that measures long-term user engagement. It is the percentage of customers who continue buying from you or paying for your service. It shows how well your existing customers engage with the products or services. It also indicates how successful you are in meeting your customer needs.
A high retention rate means your customers are happy with your offerings and engaging with your business well. On the contrary, a low retention rate may indicate you are not providing satisfactory customer service or do not appreciate your customers as they expect. It may also suggest that you did not acquire the right customers, which shows the failure of your marketing strategy.
Besides user engagement, retention rate is also critical for cost management. Acquiring a new customer is more costly and time-consuming than retaining one. Therefore, you should provide the best services to your customers to retain them and turn them into loyal customers.
How to Improve User Engagement?
Understand Your Audience
The first step to improve user engagement is to understand your target audience. The better you know your audience, the better you will serve them. Understanding your audience help you achieve the following goals:
- Tailor products and services according to prospective customer needs.
- Create engaging content that addresses your target audience’s needs and demands.
- Provide personalized customer service to make existing customers feel appreciated.
- Create marketing campaigns tailored to target the right audience, resulting in better conversion.
- Learn about user engagement challenges and act accordingly.
To understand your audience, their needs, interests, and challenges, you should:
Define Your Target Audience
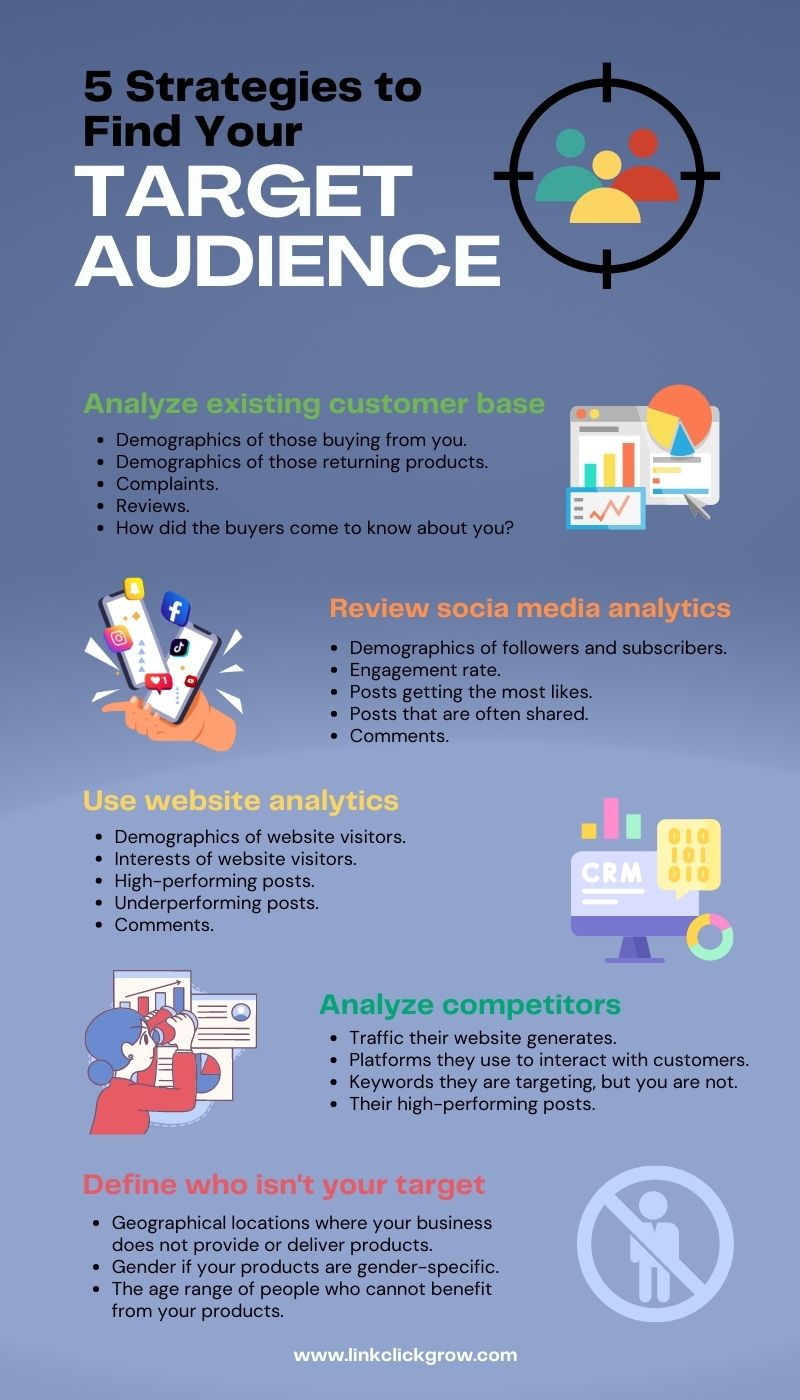
Define who your target audience is and what are their problems, pain points, interests, and demands. You can identify your audience by exploring the demographics of your existing customers, analyzing the audience your competitors are targeting, reviewing social media and website analytics, and determining who is not your target audience.

Collect Feedback
Collect feedback from visitors, social media followers, and website visitors. Feedback can give you valuable information, like the challenges your visitors face and their expectations of your brand. It also helps you build strong relationships with your customers and visitors.
Conduct Surveys
Conduct surveys during different stages of the customer journey. You can create diverse surveys for various segments of users. For example, you may contact people who abandoned their shopping cart and ask why they did not complete their purchase. To create powerful surveys that help you make informed decisions based on insights, I recommend using Woorise.
Read Comments
People would leave comments on your blog posts and social media posts. The comments may include suggestions, questions, complaints, and feedback. Regardless of what the comment is about, you should always read them and respond as well. Reading comments helps you better understand your audience while responding to comments makes your followers/customers feel valued.
Focus on User Experience
User experience is directly linked to user engagement. A better user experience leads to a better engagement rate. Besides providing relevant and authentic content to your audience, ensuring it is easy to read and consume is critical.
To analyze the readability score of your content, I recommend using a tool or plugin like AIOSEO. AIOSEO gives a detailed overview of the readability score, which can significantly help to improve the content.
To ensure an ideal user experience, you should:
- Avoid excessive popups and full-screen advertisements that cause distraction.
- Ensure your website loads correctly on screens of all devices, including iPads and mobile devices.
- Place CTAs where they are easily visible.
- Use short sentences and paragraphs to make content easy to read.
- Use bullet points, tables, and lists to highlight important information.
- Internally link web pages so that users can easily navigate your website.
- Ensure there are enough white spaces to make your web page look visually appealing.
- Use font sizes that are easy to read.
- Improve page load speed. Nitropack and WP Rocket are popular tools many use to optimize page load speed.
- Proofread the content to ensure there are no grammatical mistakes. Several tools, such as Grammarly, ProWritingAid, and WhiteSmoke, can check your content for grammatical errors.
Improve Customer Servicer
Customer service has a massive role in determining how well users or customers engage with your brand. You can provide customer service to your existing or prospective customers through many channels, such as email, telephone, or live chat. Among all the channels, live chat is the most effective.
Compared to telephone or email support, live chat support enables businesses to provide service to their customers in real-time. Customers can share their concerns and get answers or solutions immediately.
Customer service helps you:
- Retain customers by providing support to existing customers.
- Make existing customers refer your business to others.
- Better understand the needs of your customers.
- Acquire new customers by recommending the right products to prospective customers.
Create Inclusive Content
Inclusive content ensures your content is accessible to everyone regardless of any disabilities or limitations they may have. It also enhances user engagement by meeting the needs of a diverse audience. The following are the essential characteristics that define an inclusive content:
- Easy to read and understand.
- Accessible to all people, including those with impairments or poor knowledge levels.
- Correctly displays and operates on all devices.
- Empathetic and free from prejudice.
To create inclusive content, ensure:
- Your website displays correctly on all browsers.
- Users can navigate the website even without a mouse.
- The color scheme works well for audiences with visual impairments.
- Content is created in all formats, i.e., audio, video, and text.
- All forms, including subscription and feedback forms, display explicit instructions on how to fill out a form.
- You offer a variety of payment methods.
- Videos and audio have transcripts.
Display Social Proof
It is human psychology that they need social proof before they convert into leads or customers. People need evidence that others have used your products or services and found them helpful. In other words, people are likely to follow the actions of others while deciding to complete a particular action on your site.
Therefore, to improve user experience, you should display social proof, such as reviews, testimonials, awards, and customer mentions. You can also leverage influencer marketing and get an influencer to recommend your product or service.
When displaying social proof, ensure they are visible to all visitors.
Track and Analyze Performance
To improve user engagement, you must track and analyze your performance. Monitor user engagement metrics to assess what changes you need to implement for better results. Identify the best and underperforming pages. Best performing pages help you determine what works best for your audience, while underperforming pages need improvement.
The user engagement metrics also help assess the performance of A/B testing.
Conclusion
Acquiring and retaining customers is a challenging task. You need to constantly optimize your website and provide the best user experience to your visitors. The more time users spend on your site interacting and engaging with content, the more likely they will turn into customers and become loyal ones. Therefore, improving user engagement is critical to ensuring the long-term success of your marketing strategy.


0 Comments